pyMIND is an open-source, Python 3 based research project investigating acquisition, integration/interoperability, and visualization of multi-modal scientific data in the neurointensive/neurocritical care unit.
Our goal for this platform is to:
Catalyze more fluid and rapid hypothesis testing.
Leverage machine learning and "big data" approaches for healthcare analysis.
Generate a deeper understanding of physiological signals and foster more informative visualizations for event prediction and real-time decision-making.
Funding
We thank the following organizations for funding this project:
Roddy-Holden Foundation
Faxon Friends
Lifespan Norman Prince Neurosciences Institute
Development
pyMIND was initially developed by Uday Agrawal and Adewole Oyalowo in the lab of Dr. Wael Asaad MD, PhD.
Additionally, Shane Lee PhD provided useful commentary and insight at project onset; Andrew Pilling (Med Student) was instrumental to troubleshooting and testing.
Acquisition
Highlights:
Cross-platform interface for connecting to devices and visualizing data.
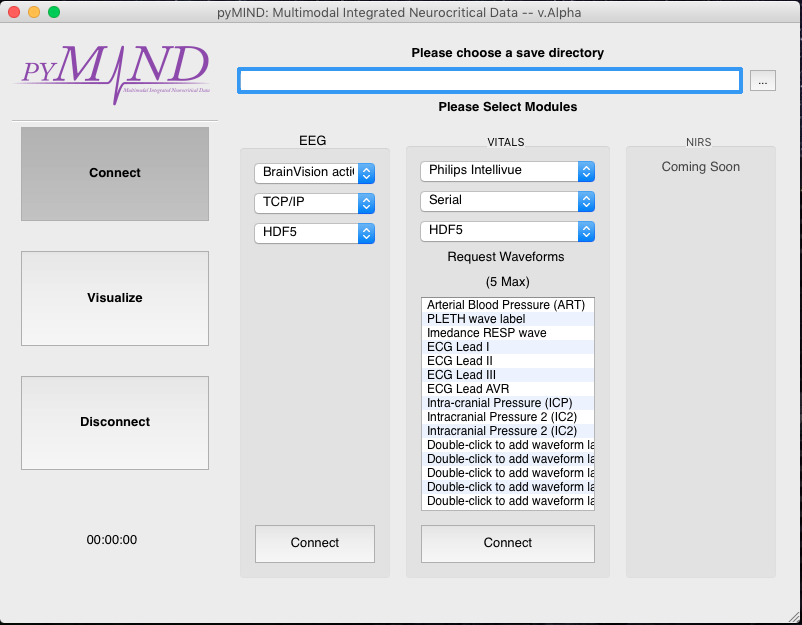
Currently connects to Philips Intellivue monitors (and attached peripherals) and BrainProducts/BrainVision EEG actiCHamp amplifier.
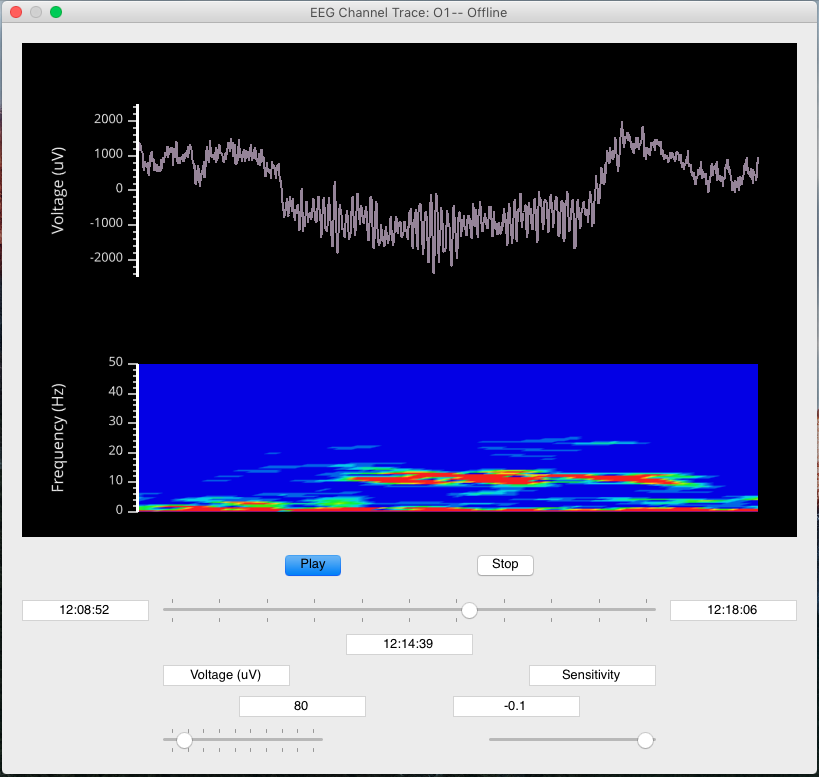
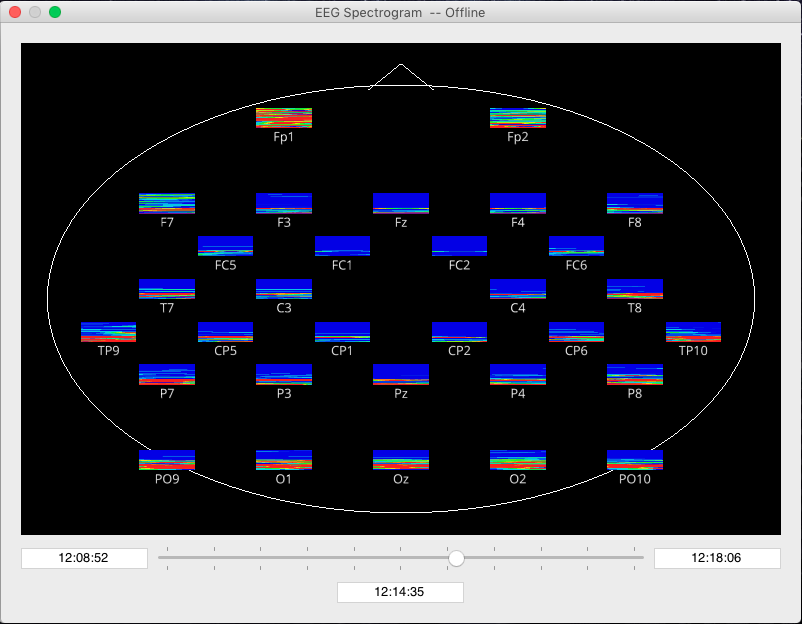
Main console.Ability to view data in realtime, view previously recorded data, and record notes.Click and drag interface for viewing numerics and waveform data side-by-side.View an individual channel or whole head montage (see Visualization tab) for EEG data.
Integration
Highlights:
Multiple, labeled data streams and metadata in one location.
Data streams can be used in realtime on computer memory and/or stored in files.
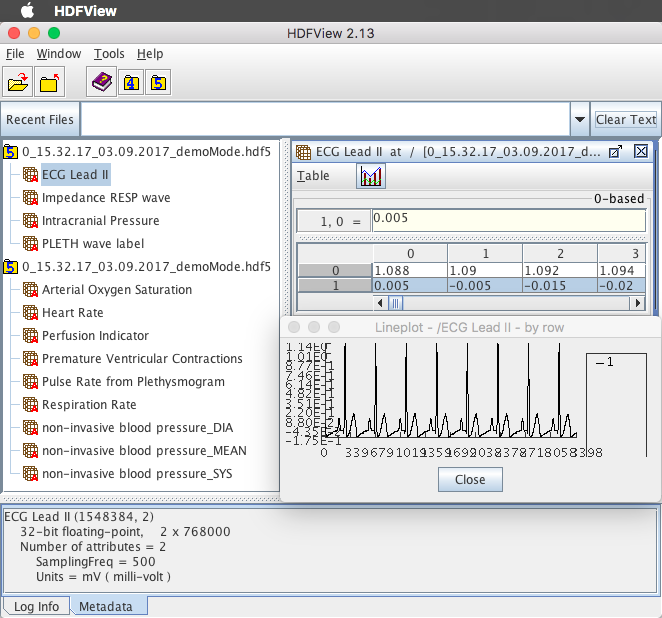
Open file format built on Hierarchical Data Format (HDF5; The HDF Group).
Custom save configurations and export to other formats.
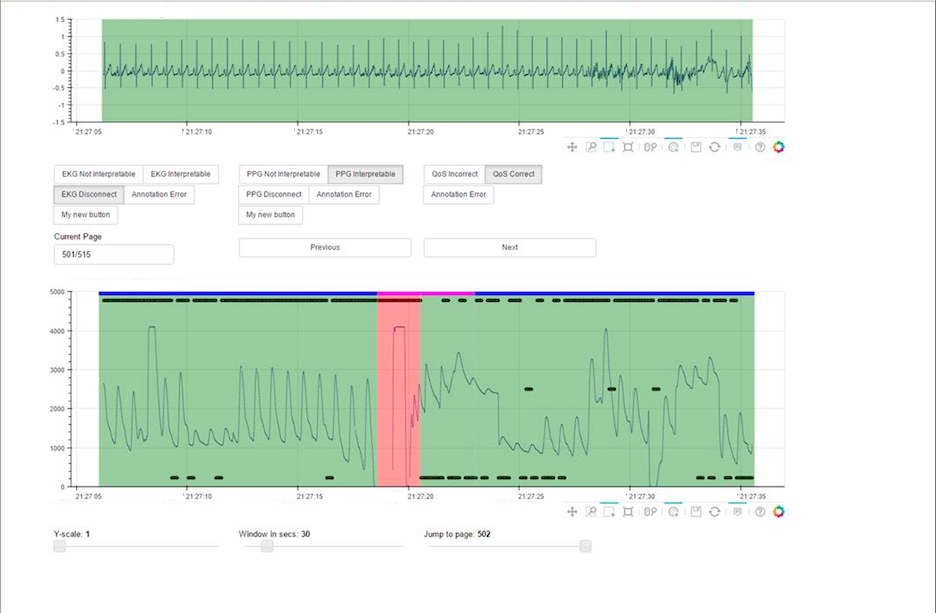
Graphical view of an HDF5 file. Note how metadata is stored alongside raw values.Visual created to investigate and annotate multiple waveforms at once.
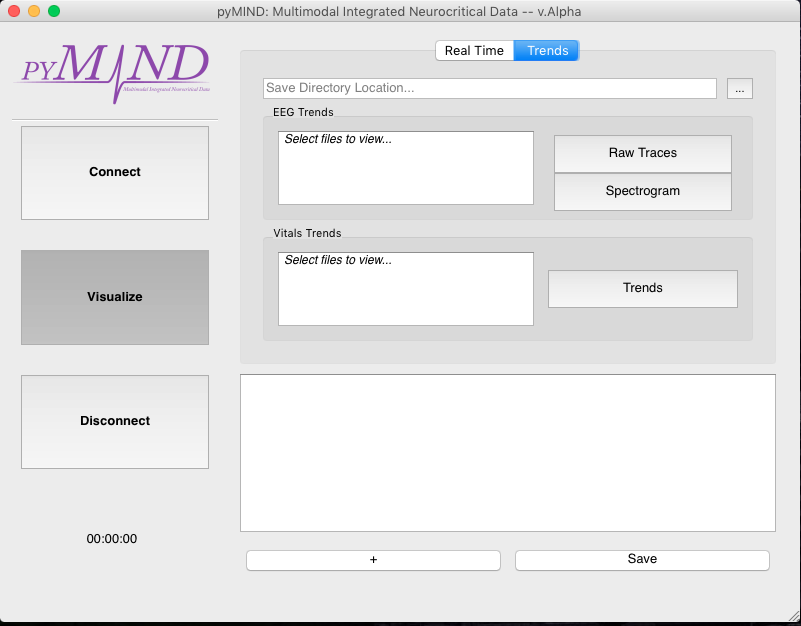
Visualization
Highlights:
Interactive and intuitive.
Utilizes graphics cards (GPU) for quick visualizations.
Data stream dependent as opposed to software specific.
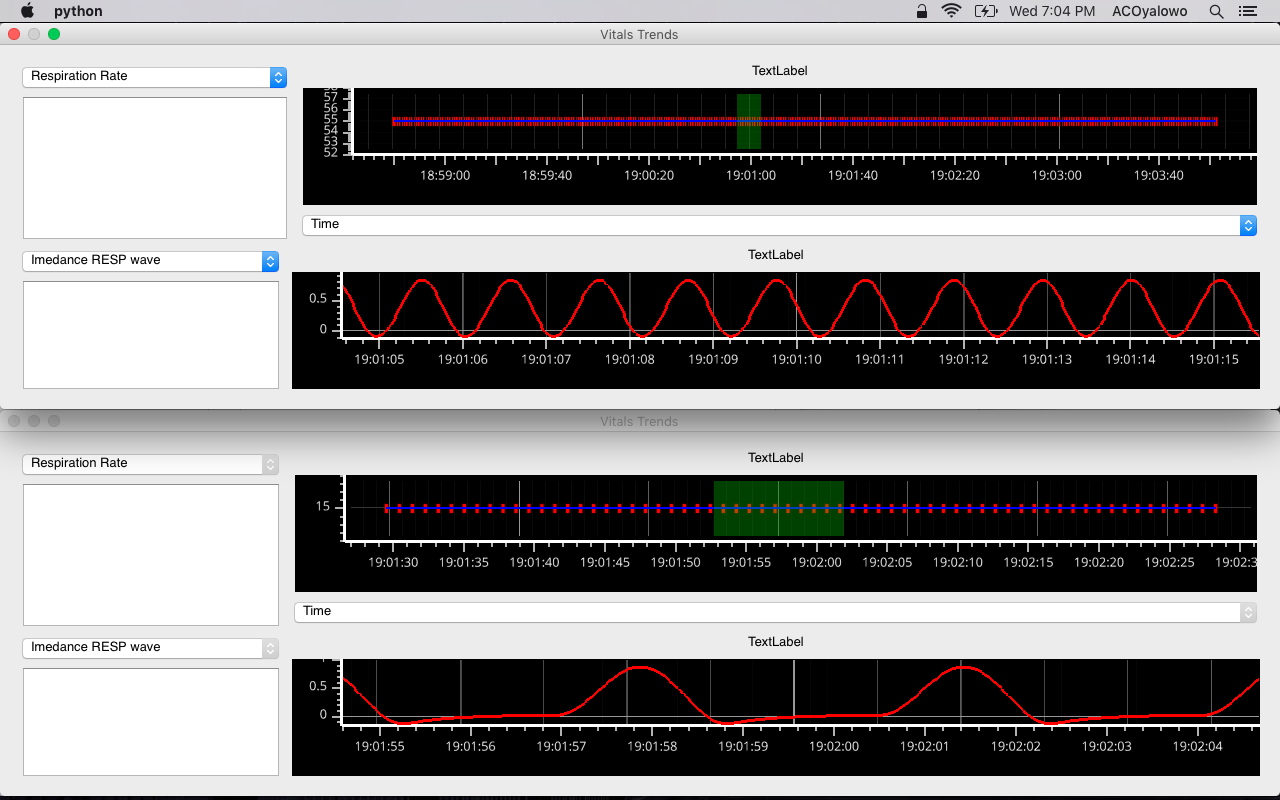
Note: If video does not play on mobile device after tapping, click the pop-out option (located in top-right of video) to view in new window.(Above) Demonstration of detecting eye-blinks with custom EEG visuals.(Above) Demonstration of detecting alpha rhythms with custom EEG visuals.(Above & Below) Interactive visuals for vitals acquired real time.EEG Head Montage showing spectral power.
Open Source
Highlights:
We encourage others to modify/use all or portions of our code for their individual research aims.
Examples
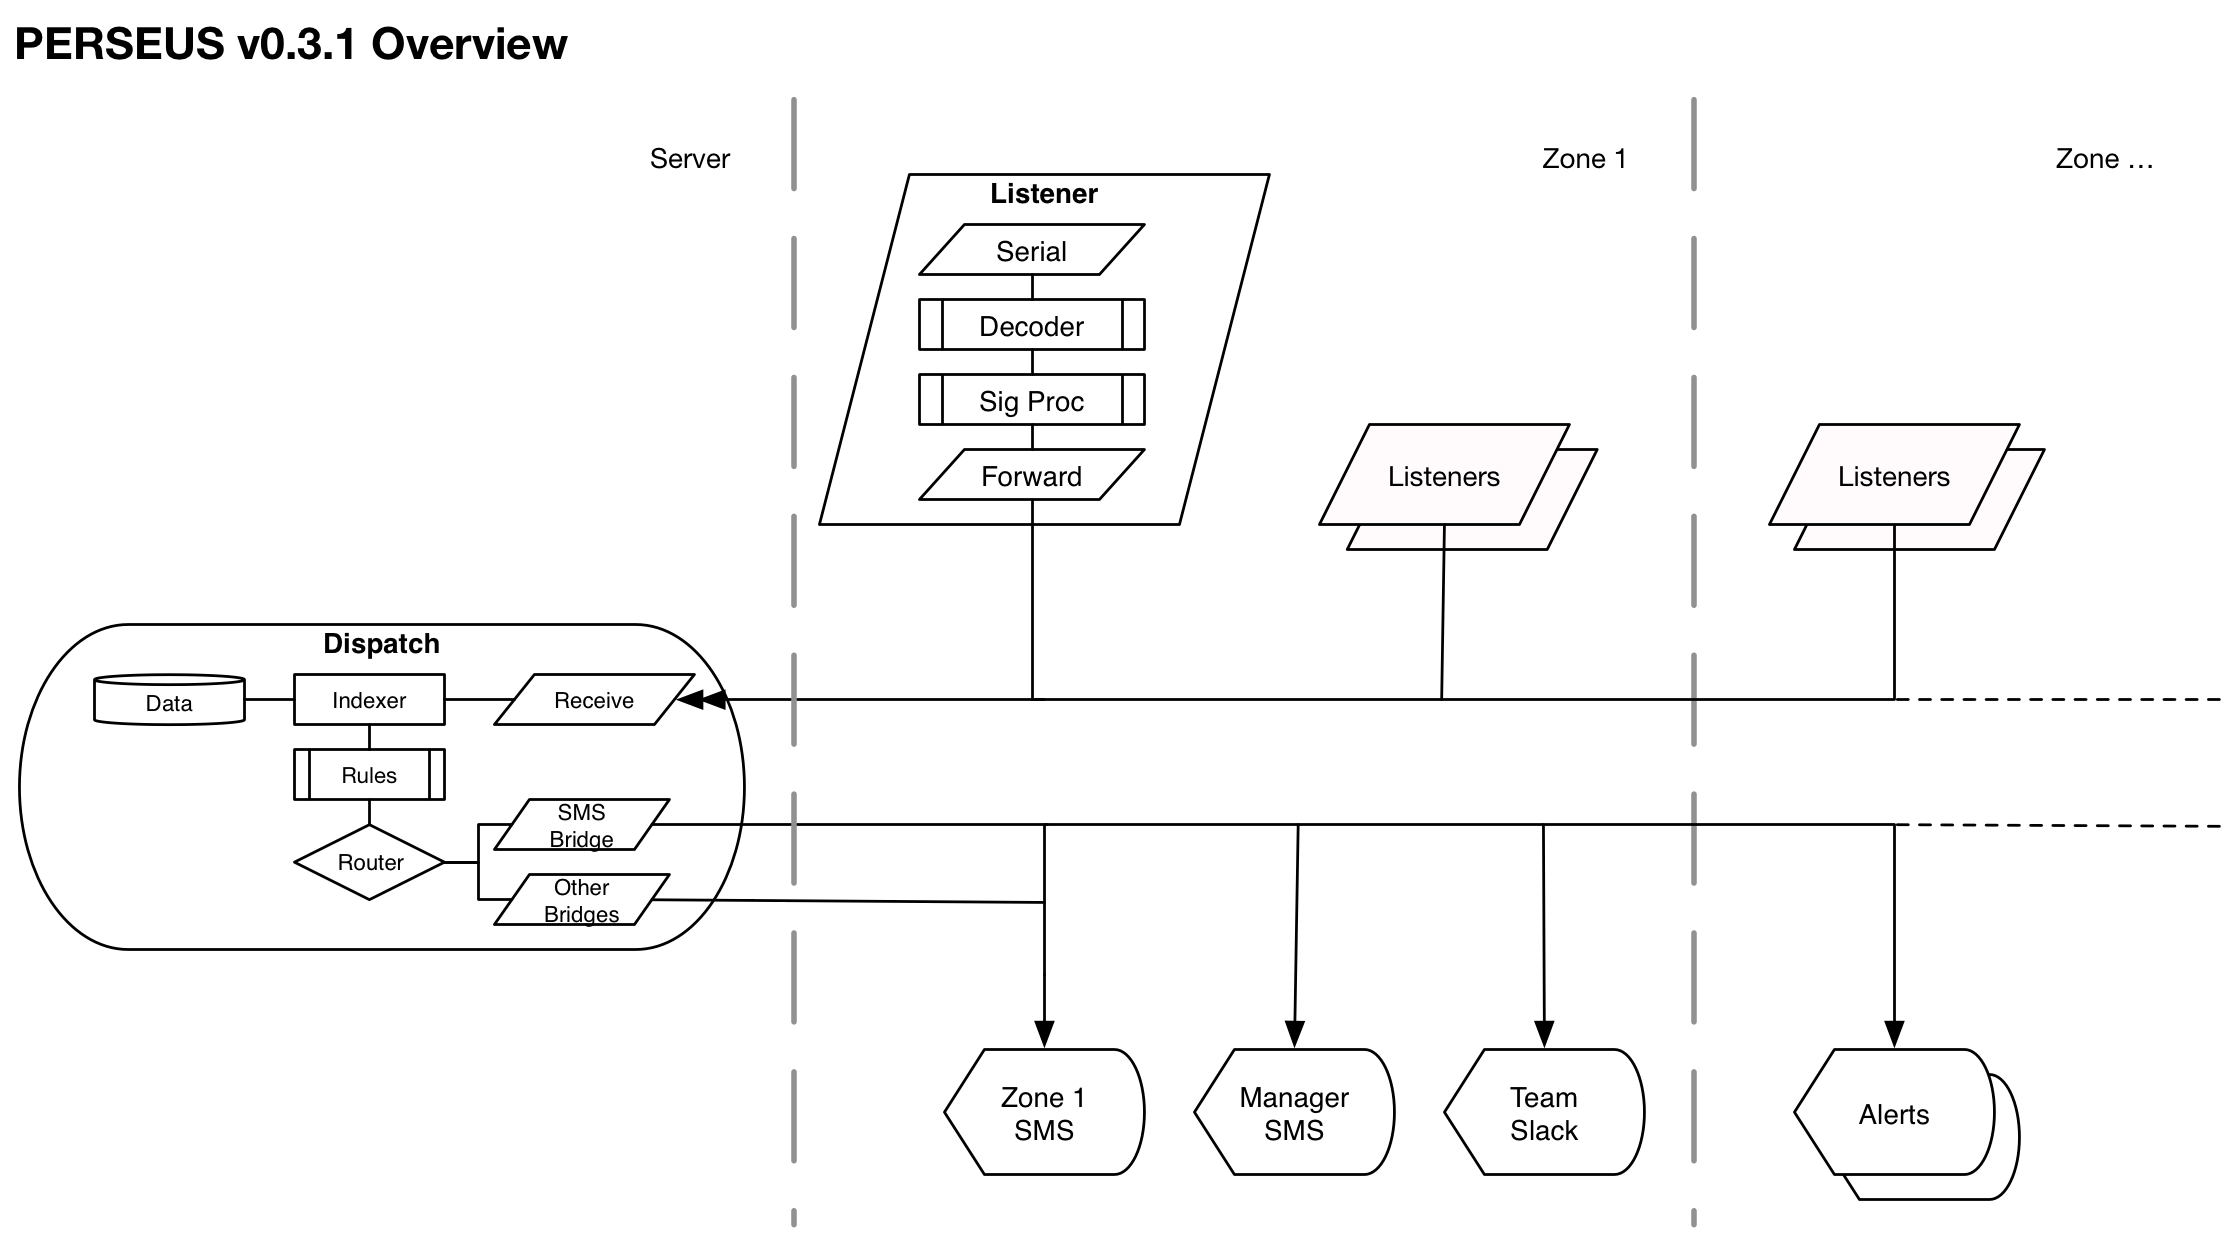
PERSEUS
Derek Merck PhD, Leo Kobayashi MD | Rhode Island Hospital
Image courtesy PERSEUS development repository.
Push Electronic Relay of Smart Alarms for End User Situational Awareness (PERSEUS) program is an integrative research and development project to study experimental alarm fatigue mitigation measures. Progress in this project is made possible using connection protocols and visualizations from pyMIND. The intervention is designed to
directly access patient physiologic datastreams from monitors,
process signals with multi-parametric algorithms to generate intelligent alerts, and
effectively communicate the information with targeted "push" messaging to specified clinical providers.